Here is my first full year tracking my investments on my website!, let’s have a look at the returns that I recieved in 2019.
All in all I achieved an average return of just over 12%.
Combined P2P Interest (2019)
[visualizer id=”35446″]
The graphs above provide the stacked returns that I have made (per month) through each of the P2P investment platforms that I invest in (Mintos, Bondora, Grupeer, Rate Setter (AU), Envestio, Crowd Estate, Fast Invest, Crowdestor, Reinvest24, Kuetzal and Monethera). Each month is marked in a separate colour, and the total investment can be seen on the bottom axis. The average investment return has also been included. Click on the graph to see more details.
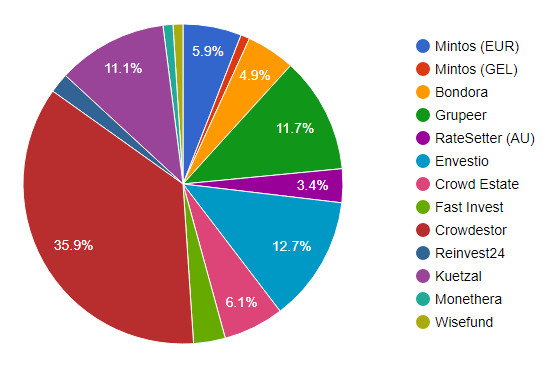
Portfolio Distribution
P2P Platform Monthly Returns
This graph above similar to the above, but shows the data in a different way. This graph makes it clear how each investment is performing each month. From this graph, I can plot averages and make trend lines to estimate future returns.
P2P vs Other Investments
This graph shows how my average P2P returns have compared to the S&P 500. As you can see from the graph, my P2P returns remained competitive with the S&P 500 and my own shares. I have also included the average returns of my share portfolio here as well. The P2P returns are shown on the solid line, and the returns from both the S&P 500 and my share portfolio are in the broken line. The month is on the bottom axis and % return is on the side. Click on the graph to see more details.
Here were all of my updates during 2019. Updates were released in the month after they were generated (i.e. my returns for January 2019 will be found in my “February 2019 Update”.
- January 2019
- February 2019
- March 2019
- April 2019
- May 2019
- June 2019
- July 2019
- August 2019
- September 2019
- October 2019
- November 2019
- December 2019